
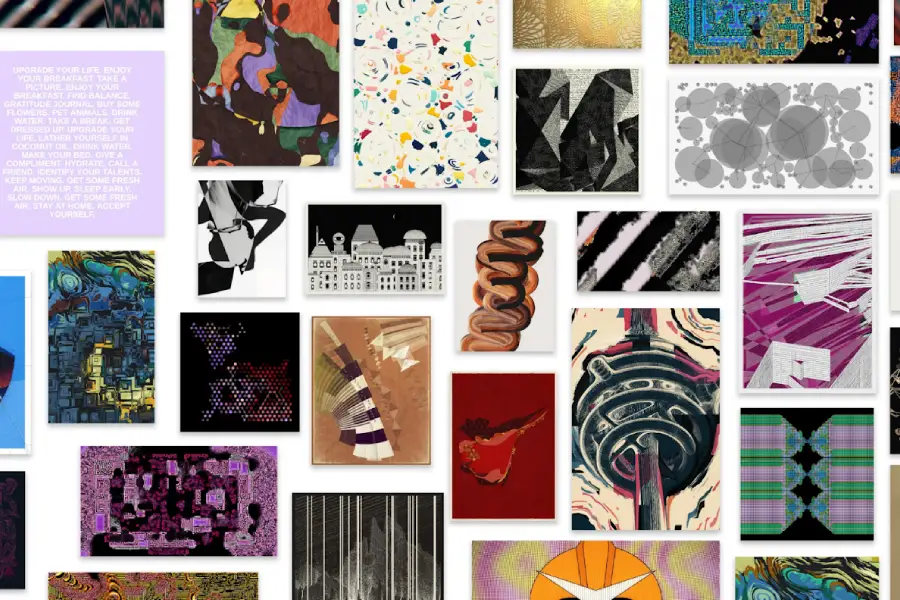
In today’s ever-evolving digital landscape, the fusion of data and art reveals unexpected beauty and insights. We’ve discovered a fascinating blend of creativity and information through Generative Art Data Visualization. This innovative field is crafting a narrative where numbers meet nuanced visual expressions, carving stories from datasets that might otherwise seem mundane.
Generative Art Data Visualization
Generative art and data visualization are two compelling forms of digital expression. Generative art, at its core, uses algorithms to transform code into autonomous artworks, while data visualization translates quantitative information into visual formats, revealing patterns and anomalies. Although they have distinct goals one aesthetic, the other informative they intersect meaningfully, offering both beauty and clarity. This overlap invites us to explore not just how we present data, but how we feel about it. It transforms sterile spreadsheets into vibrant experiences that resonate on emotional and intellectual levels.
Historical Context and Evolution
1. Early Developments:
As we journey back, we find early pioneers experimenting with computational art in the 1960s. Artists like Frieder Nake and Vera Molnar were among the first to realize that computers could create art through algorithmic rules, setting the stage for generative processes. During the same period, data visualization began taking shape, driven by the need to understand complex data sets more intuitively. Who knew that the seemingly disparate paths of artistic exploration and analytical necessity would later converge so dynamically?
2. Key Milestones:
Fast forward a few decades, and technological advancements like Processing, a flexible software sketchbook, and D3.js, a JavaScript library for data-driven documents, have enabled creatives to craft intricate visualizations. These tools opened doors to a new era where artists and data scientists alike could harness computers’ power to create stunning visual narratives.
Techniques and Tools: An In-Depth Exploration
Delving deeper into the fascinating world of techniques and tools reveals a dynamic intersection of art and technology. Here in Generative Art Data Visualization, algorithms are the silent powerhouses driving innovation, while software and programming languages provide the canvas and brushes.
Overview of Algorithms
1. Fractals
Fractals are repeating patterns that display at every scale and are used extensively in generative art to create complex, infinitely intricate visuals. The beauty of fractals, such as the Mandelbrot set, lies in their self-similar nature simple formulas can yield vast, stunningly complex designs. They’re not just mesmerizing to view but also mathematically fascinating, embodying nature’s recursive principles.
2. Cellular Automata:
Cellular automata consist of grids of cells that evolve over discrete time steps according to a set of rules based on the states of neighboring cells. This approach can simulate life-like behaviors and translate simple rules into unexpectedly elaborate systems, like Conway’s Game of Life. Artists use these systems to create dynamic, evolving artworks that mimic natural processes.
3. L-Systems
Originally developed for modeling the growth of plants, L-systems (Lindenmayer systems) use recursive rules to generate naturalistic, branching patterns. This method is perfect for generating fractal-like forms and structures, offering a robust tool for artists aiming to emulate the organic complexity of flora or coral.
4. Perlin Noise
Often used in computer graphics for procedural texture generation, Perlin noise introduces controlled randomness, offering a way to create gradients and natural variations regarding Generative Art Data Visualization. It’s widely used for generating textures like marble, clouds, or terrain, creating visual interest through pseudo-randomness.
Software and Programming Languages
5. Processing and p5.js
Processing is an open-source graphical library and integrated development environment (IDE) built for the electronic arts and visual design communities. Known for its simplicity, it’s ideal for both novices and experts wanting to produce visual art with code. p5.js, a JavaScript library inspired by Processing, broadens accessibility by running directly in web browsers, allowing artists to craft interactive web-based art.
6. D3.js
As a JavaScript library, D3.js shines in creating complex data visualizations by enabling precise and customizable representations of data. While not explicitly for generative art, its power lies in data-driven transformations which, combined with creativity, produce stunning visuals. D3.js allows developers to bind data to a Document Object Model (DOM), and then apply data-driven transformations to the document.
7. Python and Libraries
Python’s versatility and ease of use make it popular in both data science and creative coding realms. Libraries like Matplotlib and Seaborn provide data visualization capabilities, while others like Turtle and PyCairo are suited for generative art, offering robust tools for coding visual stories with code.
8. Design Software and Plugins
Beyond coding languages, design software such as Adobe Illustrator and plugins like Scriptographer provide graphical interfaces to explore Generative Art Data Visualization. These tools cater to artists who might not be coding-savvy but are eager to delve into algorithm-assisted creativity, blending user-friendly interfaces with computational power.
By combining these algorithms and tools, generative art and data visualization practitioners can transcend conventional artistic limitations, crafting works that not only astonish with their complexity but also enhance our understanding of the intricate data structures that frame our world. The synergy between precise code and creative vision sets the stage for endless possibilities, letting artists paint with data itself.
Applications and Case Studies
Real-world Examples
Generative art in data visualization is making significant strides across various domains, illustrating complex narratives through engaging visuals. Here are two exemplary cases:
- Jer Thorp’s Data Visualization for The New York Times
Jer Thorp has made significant contributions to transforming how we understand and interact with large datasets. His work for The New York Times effectively brings life to data that might otherwise remain abstract in spreadsheets. For instance, Thorp’s visualization of the movements of visitors within the Museum of Modern Art provided not just aesthetic value but also critical insights into how people experience art. By mapping visitor pathways, Thorp’s work helped museum curators understand which artworks or exhibits captured more engagement and how space influences visitor behavior. This project exemplifies how generative art can render complex, static data into dynamic stories, making it accessible and engaging for public audiences.
- Martin Wattenberg’s “Wind Map”
The “Wind Map,” created by Martin Wattenberg and his collaborator, Fernanda Viegas, is a mesmerizing example of how real-time data can be transformed into art. This project visualizes the invisible patterns of wind across the United States by translating meteorological data into fluid, graphical representations. Lines of different thicknesses and speeds across the map convey the velocity and direction of wind currents in a way that is not only informative but also aesthetically pleasing considering Generative Art Data Visualization. By visually manifesting natural phenomena like wind, Wattenberg’s “Wind Map” turns an ordinarily invisible force into a tangible artwork, allowing a broad audience to appreciate and understand environmental dynamics more deeply.
Artists and Pioneers
Influential Figures
- Jer Thorp
Jer Thorp stands out in the realm of data-driven art with a distinctive ability to turn raw data into meaningful narratives. Co-founder of The Office for Creative Research, Thorp has been instrumental in exploring the intersections of data, design, and culture. His use of generative techniques not only creates art but also helps demystify data by embedding it within cultural and social contexts. Thorp’s projects often explore themes of privacy, society, and the human experience, using art to address these complex issues. His work combines the rigor of scientific inquiry with the nuance of artistic expression, seeking to make data more humane and relatable.
- Martin Wattenberg
Martin Wattenberg is a pioneer in the field of data visualization, known for his interactive and innovative approaches to data representation. His collaborations with Fernanda Viegas have resulted in projects that challenge traditional boundaries between art and science. As a part of Google’s “Big Picture” research group, Wattenberg has been at the forefront of developing visualization techniques that help us make sense of vast data landscapes. His work not only informs but inspires, bridging the gap between the analytical and the aesthetic. Through pieces like “The Shape of Song,” which visualizes the structure of music, Wattenberg has shown how data can be reimagined into strikingly original visual compositions that broaden our understanding and appreciation of art and data alike.
These artists, through their pioneering work, have expanded the horizons of what is possible at the nexus of generative art and data visualization, laying the groundwork for future innovations in this exciting field. Their projects not only convey information but also provoke thought and spark curiosity, challenging us to revisit our perceptions of both art and data.
Challenges and Ethical Considerations
Data Privacy and Algorithmic Bias
When it comes to the crossroads of generative art data visualization, ethical considerations take center stage. Using personal or sensitive data demands careful attention to privacy. Both artists and engineers have to make sure that the data they incorporate into their creations is anonymized, safeguarding individuals’ identities and honoring their privacy rights. As AI takes on a bigger role in art creation, the transparency of algorithms becomes even more vital. These algorithms aren’t perfect; they can unintentionally reflect or even worsen existing biases inherent in the data they handle. For example, if an AI model is trained on biased or unrepresentative data, the art it generates might inadvertently promote stereotypes or convey a skewed narrative. This underlines the need for a thorough evaluation of data sources and an ethical approach to designing algorithms to reduce bias and foster fairness.
Additionally, since visualizations can shape how we perceive things and influence our decisions, there’s a duty to present data in a truthful and ethical manner. Being transparent about the methods used and clearly communicating any limitations or uncertainties helps to build trust with audiences. This kind of accountability is crucial as we continue to weave AI into creative processes, ensuring that the tools we create respect ethical lines and bolster, rather than undermine, the integrity of artistic expression.
Future Trends
Emerging Technologies
The future holds exciting possibilities as technological advancements in AI and machine learning continue to shape generative art and data visualization. These emerging technologies promise to offer more personalized and interactive experiences, transforming how we engage with art and data. Imagine visualizations that adapt in real-time based on viewer interaction or environmental conditions, creating dynamic experiences that evolve as you engage with them. Such advancements could revolutionize educational tools, museum displays, and public installations, making data stories more engaging and accessible to a wider audience.
The capabilities of deep learning could also enhance the aesthetic and functional aspects of generative art. AI models can learn sophisticated patterns and styles from large datasets, enabling artists to explore new creative territories with AI as a collaborative partner. However, this integration of AI in art creation doesn’t come without challenges it raises questions about authorship and originality. As AI begins to play a more significant role, we may need to redefine what it means to be a “creator” and how we attribute creative output.
In this evolving landscape, the dialogue between technologists, artists, and ethicists will be crucial. This collaboration will help navigate the complexities and ensure that these technologies are applied thoughtfully, maximizing benefits while addressing potential pitfalls. The future is bright for those willing to innovate and explore, with generative art and data visualization at the forefront of creative and technological convergence.
Conclusion
In this ever-expanding domain of Generative Art Data Visualization, we’re not just creating art or visualizations; we’re crafting experiences that touch on the very essence of storytelling in our digital age. Through generative art data visualization, we continue to explore how technology can deepen our engagement with the world around us, crossing the lines between analysis and artistry with vibrant aplomb.
1. How does generative art impact data comprehension?
Generative art provides a creative lens that makes complex data more accessible and engaging. Transforming data into interactive visuals, helps users grasp intricate patterns intuitively.
2. What role does AI play in generative art and data visualization?
AI acts as both a tool and collaborator, aiding in pattern recognition and automating tedious processes. This partnership allows artists and analysts to focus more on strategic creativity while AI handles execution.
3. Are there ethical concerns with these blended technologies?
Yes, ethical considerations are significant, particularly around data privacy and potential biases inherent in algorithmic processes. Ensuring ethical practices is crucial for maintaining trust and transparency in these fields.